NXW2.1P10 - Port Dashboard With Higher UIX Usability (SeePort)
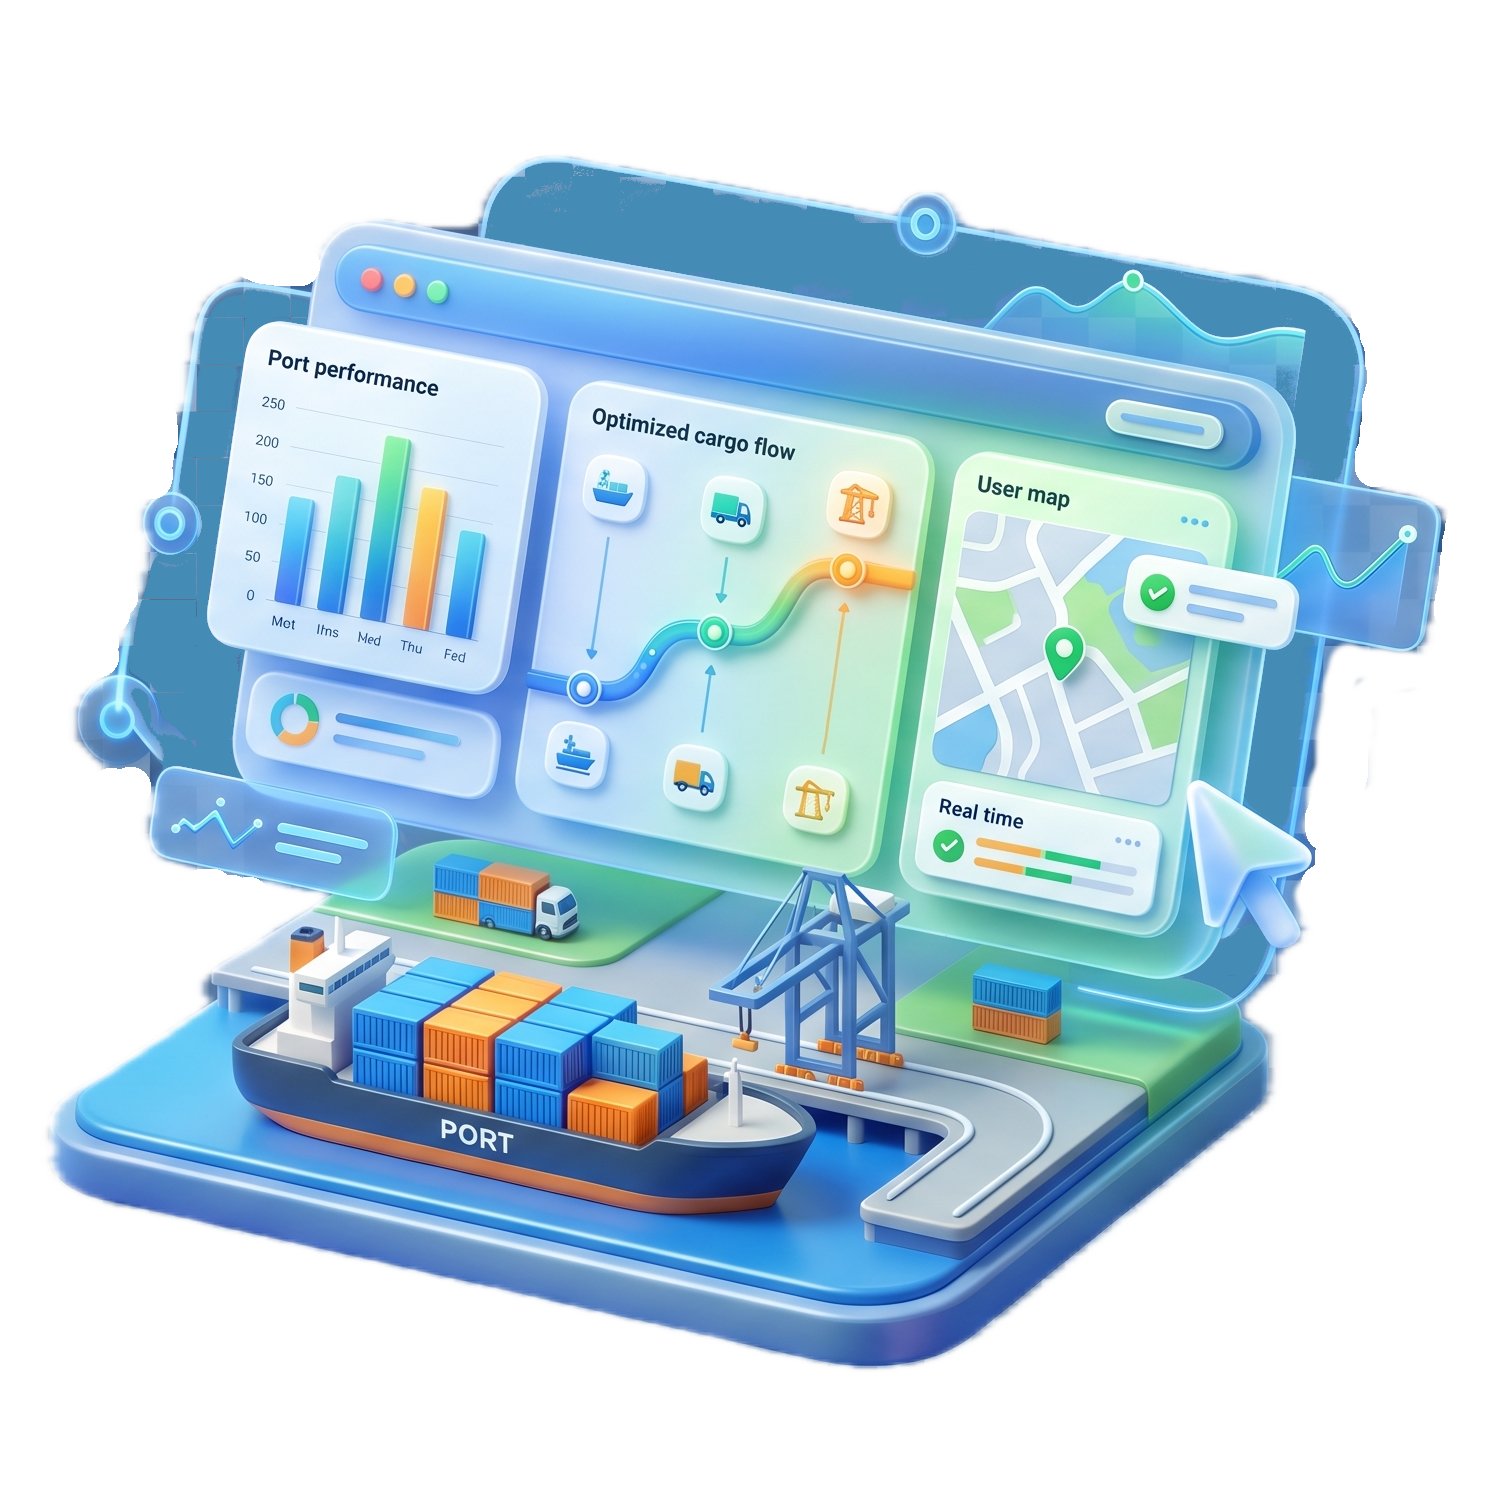
A simple dashboard to explore some KPIs of the Port of Sines data, that was under a systematic scientific study of usability of its UIX.
-
Main Gain(s): Easy and clear data navigation
-
Core Contributions: (concept) M.B. Santos; (implementation) A. Campos; (integration) E. Rocha
Use Cases:
-
Historical data of the Port of Sines.
-
Start TRL: 2 - Started from scratch.
-
Final TRL: 7 - Do not have a higher TRL since it was not tested by workers of the Port of Sines.
-
Main Features
- Interactive visual analytics dashboard for container terminal operations: A web-based interface that helps users explore, filter, and interpret operational data, including container movements, container stays, vessel activity, and equipment usage.
- Forecasting and results-analysis interface: A module that applies time-series forecasting methods and presents results in a clear interface to support operational decision-making and future planning.
Master Thesis: SeePort a Dashboard for Analysis and Forecasting of Seaport Performance. Campos, A. (2025). Universidade de Aveiro. Mestrado em Engenharia Informática. Orientada por: M. B. Santos, T. Araújo.
Images and Videos
| Dashboard Demonstration |